Calls Dashboard
This page provides a comprehensive overview of the platform performance metrics for a specified period.
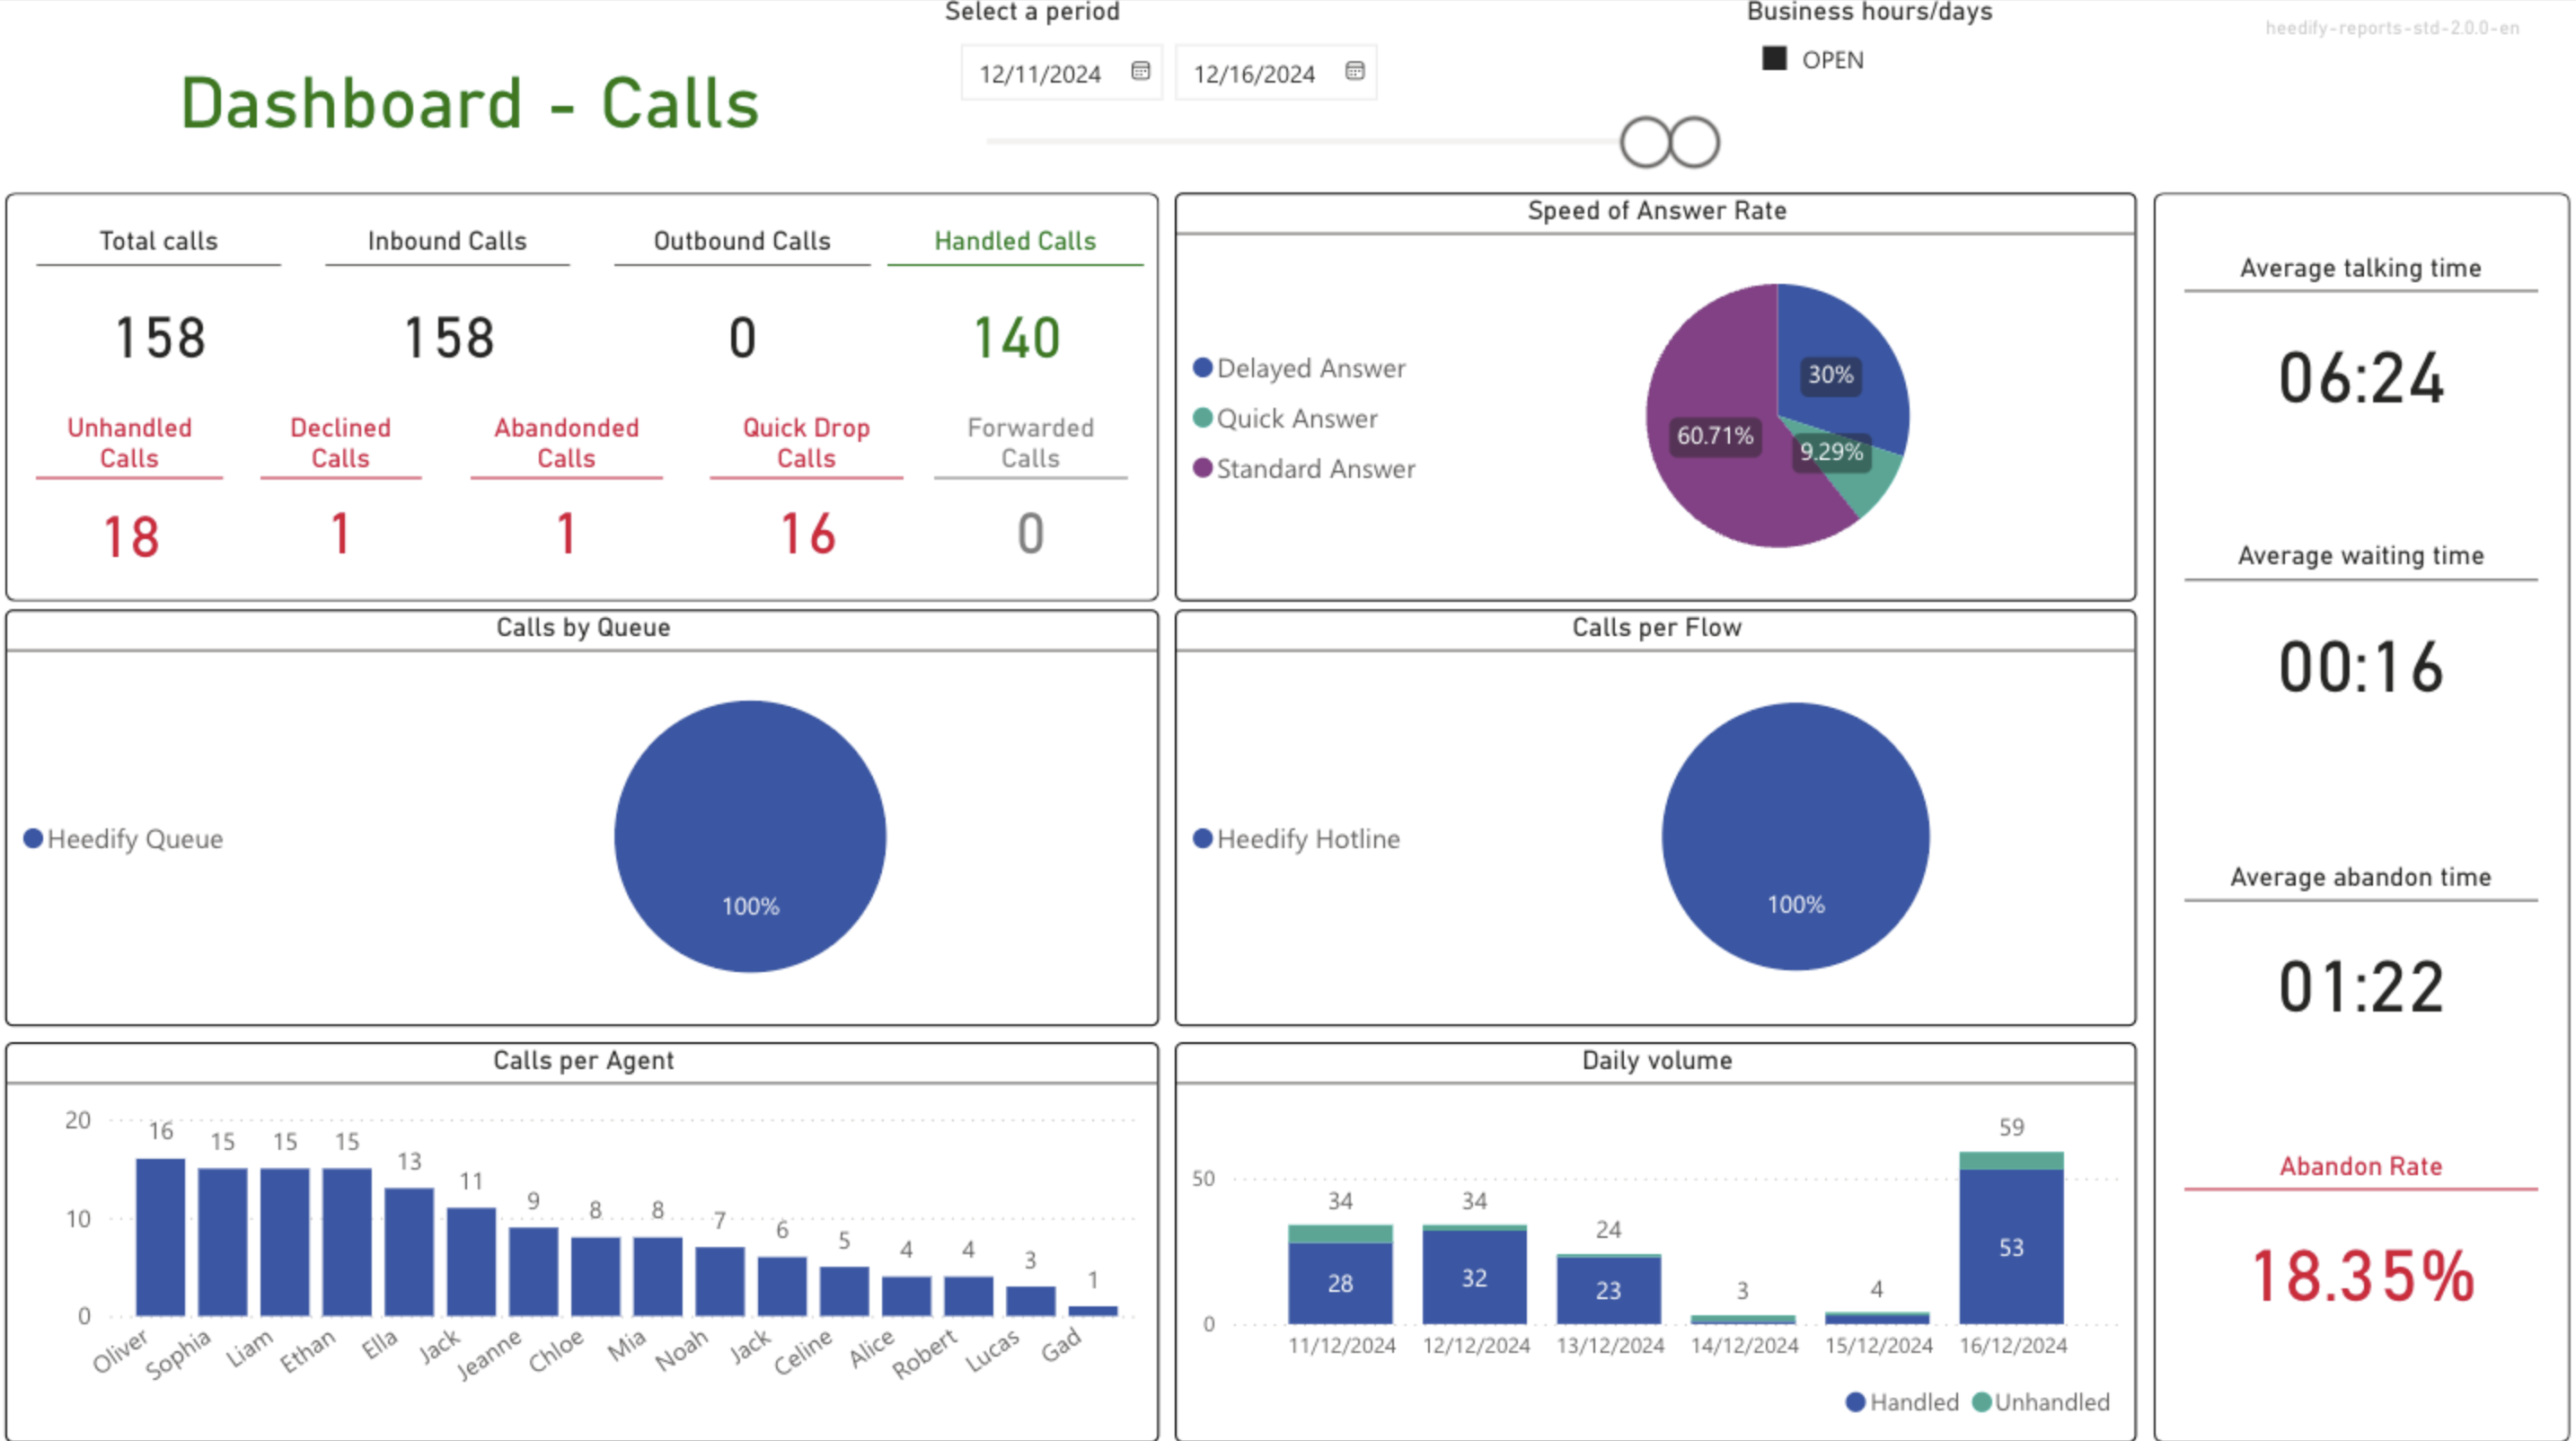
Filters
- Date Range Selector: Allows the user to select a specific period for analysis (e.g., from 5/4/2024 to 10/9/2024).
- Business Hours/Days Checkbox: Indicates if the data represents open business hours/days.
Key Metrics
- Total Calls: Total number of calls recorded in the platform during the selected period.
- Inbound Calls: Total number of calls received by the platform.
- Outbound Calls: Total number of calls made by agents to external parties.
- Handled Calls: Number of calls that were answered and handled by an agent.
- Unhandled Calls: Number of calls that were not answered by an agent.
- Forwarded Calls: Number of calls transferred by the platform (i.e in case of holiday fallback, no agent fallback…).
- Declined Calls: Number of calls that were actively refused by an agent and not handled by any other agent.
- Abandoned Calls: Number of calls dropped by customers before being answered.Abandoned calls reached at least one queue.
- Quick Drop Calls: Number of calls that were disconnected before reaching the queue.
Visualisations
Speed of Answer Rate
A pie chart categorizes calls into:
- Standard Answer: where the call begin handled by an agent between Quick Answer Threshold and Standard Answer Threshold
- Delayed Answer : where the call begin handled by an agent after Standard Answer Threshold
- Quick Answer : where the call begin handled by an agent before Quick Answer Threshold
This visual, allows for evaluating performance in terms of responsiveness to calls.
See Report Configuration section for more details about thresholds.
SLA metrics
- Average Talking Time: The average time agents spend talking with customers. This helps to understand the typical duration of calls and evaluate the efficiency of interactions.
- Average Wait Time: The average time customers spend in the queue before speaking with an agent.
- Average Abandon Time: The average time before a customer decides to hang up. This helps evaluate whether waiting times are causing customers to abandon their calls.
- Abandon Rate: The percentage of abandoned calls relative to the total number of calls. This measures customer satisfaction and the ability to respond promptly to clients.
Calls by Queue
Distribution of calls by queue. Helps identify the most requested services and analyze performance by queue to assess resource needs
Calls by Flow
Distribution of calls by flow. Helps identify the most requested services.
Calls per Agent
Number of calls handled by each agent. Helps measure workload and individual agent performance.
Daily Volume
Number of handled and non-handled calls for each day. Provides daily tracking to identify high-activity days or periods of low performance.