Wallboard
The Heedify Wallboard is a real-time monitoring dashboard designed to provide key performance metrics and insights for service queues and agents activities. It is organized into two main tabs: one for monitoring service queues and another for tracking agent performance.
Accessing the Wallboard
To access to the Wallboard, open your browser and navigate to https://wallboard.heedify.io and enter credentials.
Queues
Page Layout
Queues page is divided into sections representing different queues, displaying live operational statistics to help supervisors and managers make informed decisions.
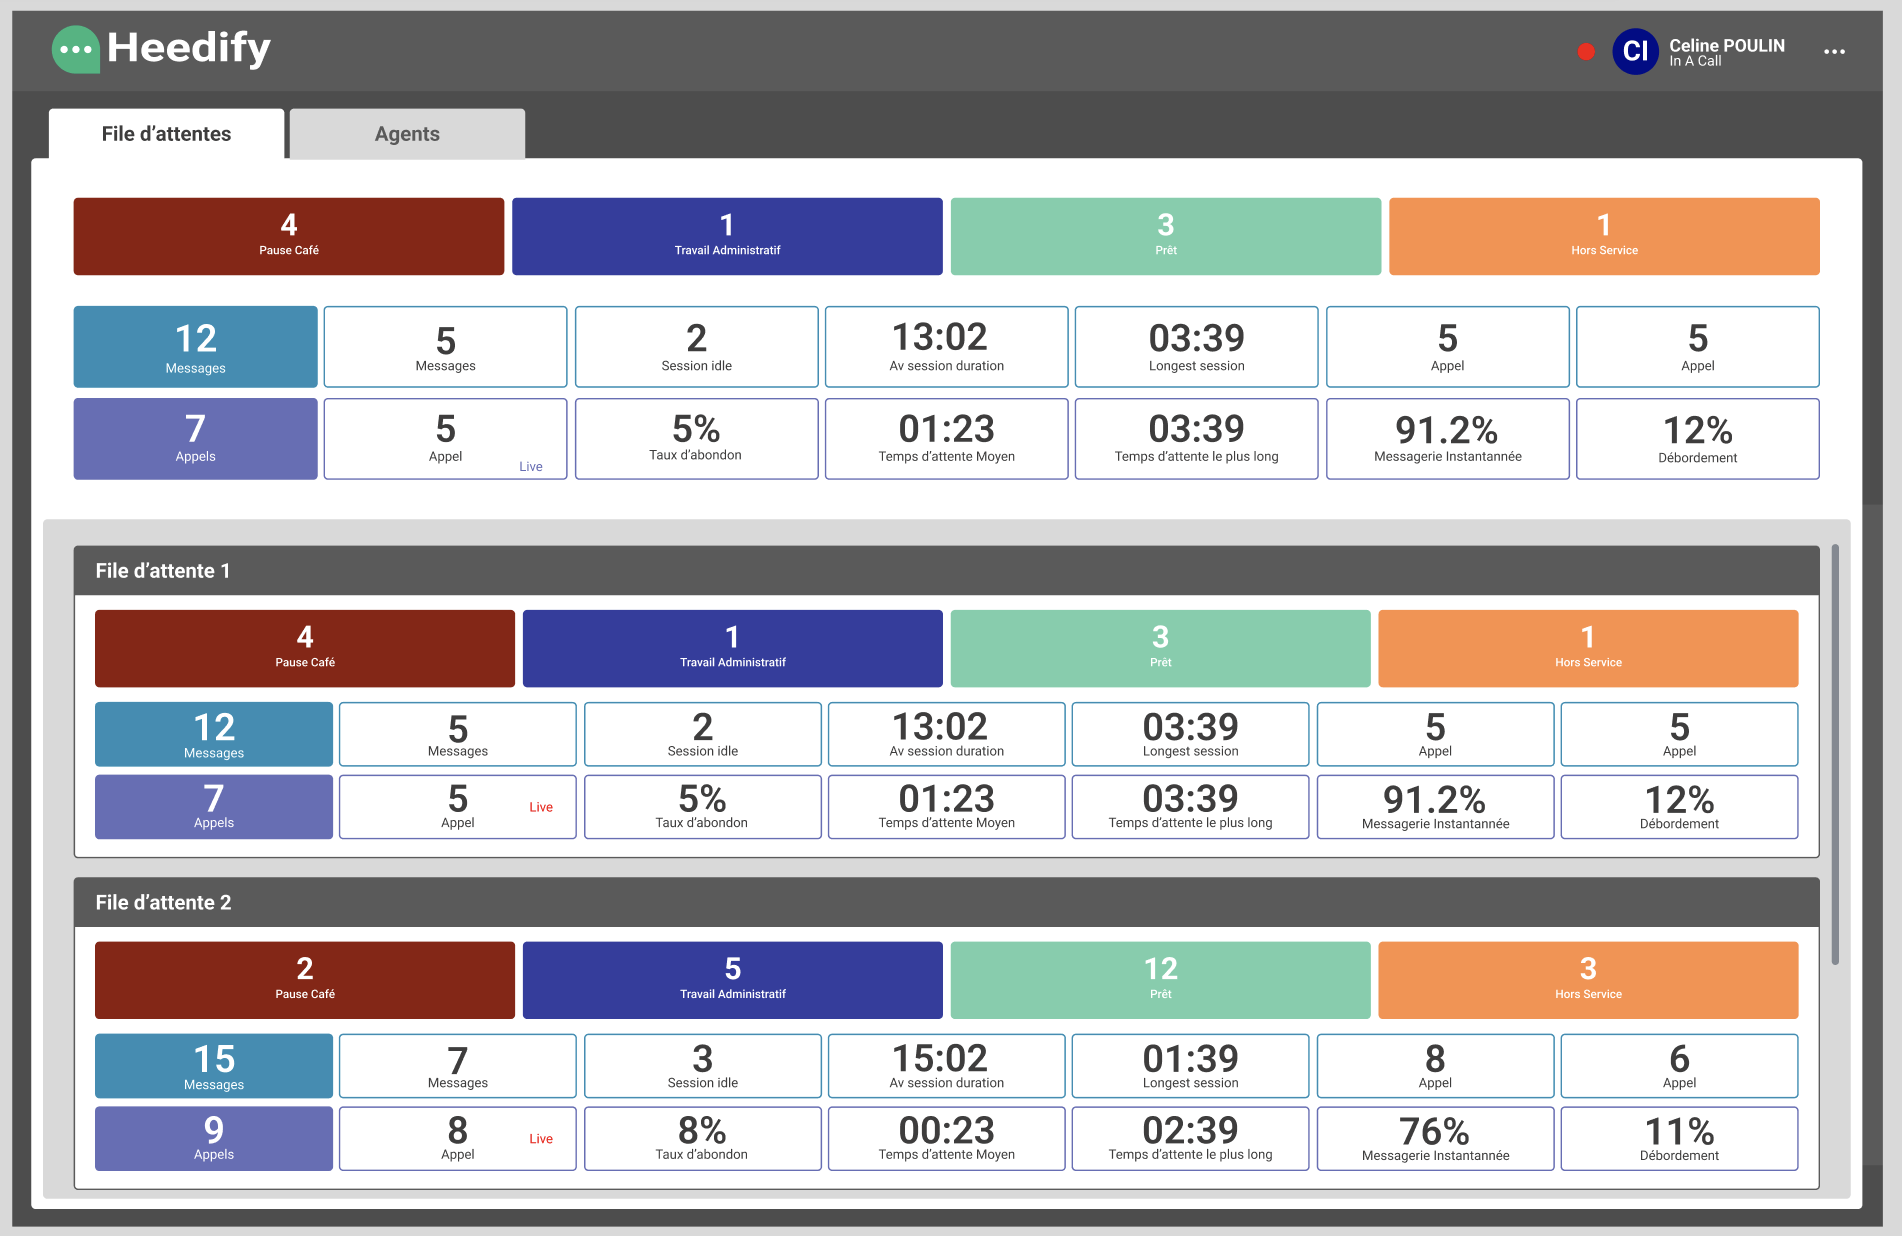
Top-Level Metrics
- Agent Status Breakdown : each queue section has status board for its agents with a colour code:
- READY: Agents available to take calls.
- COFFEE BREAK: Agents on a break.
- ADMIN WORK: Agents engaged in non-call-related tasks.
- OUT OF SHIFT: Agents logged out or off-duty.
The above activity status show the default value. Admins can define custom values
- Chat service statistics :
- Today’s total chats
- Ongoing chats
- SLA
- Avg. Wait time
- Longest Wait time
- Call service statistics :
- Today’s total calls
- Ongoing calls
- Abandon rate
- Avg. Wait time
- Longest Wait time
- Overflow
- SLA
Agents
Page Layout
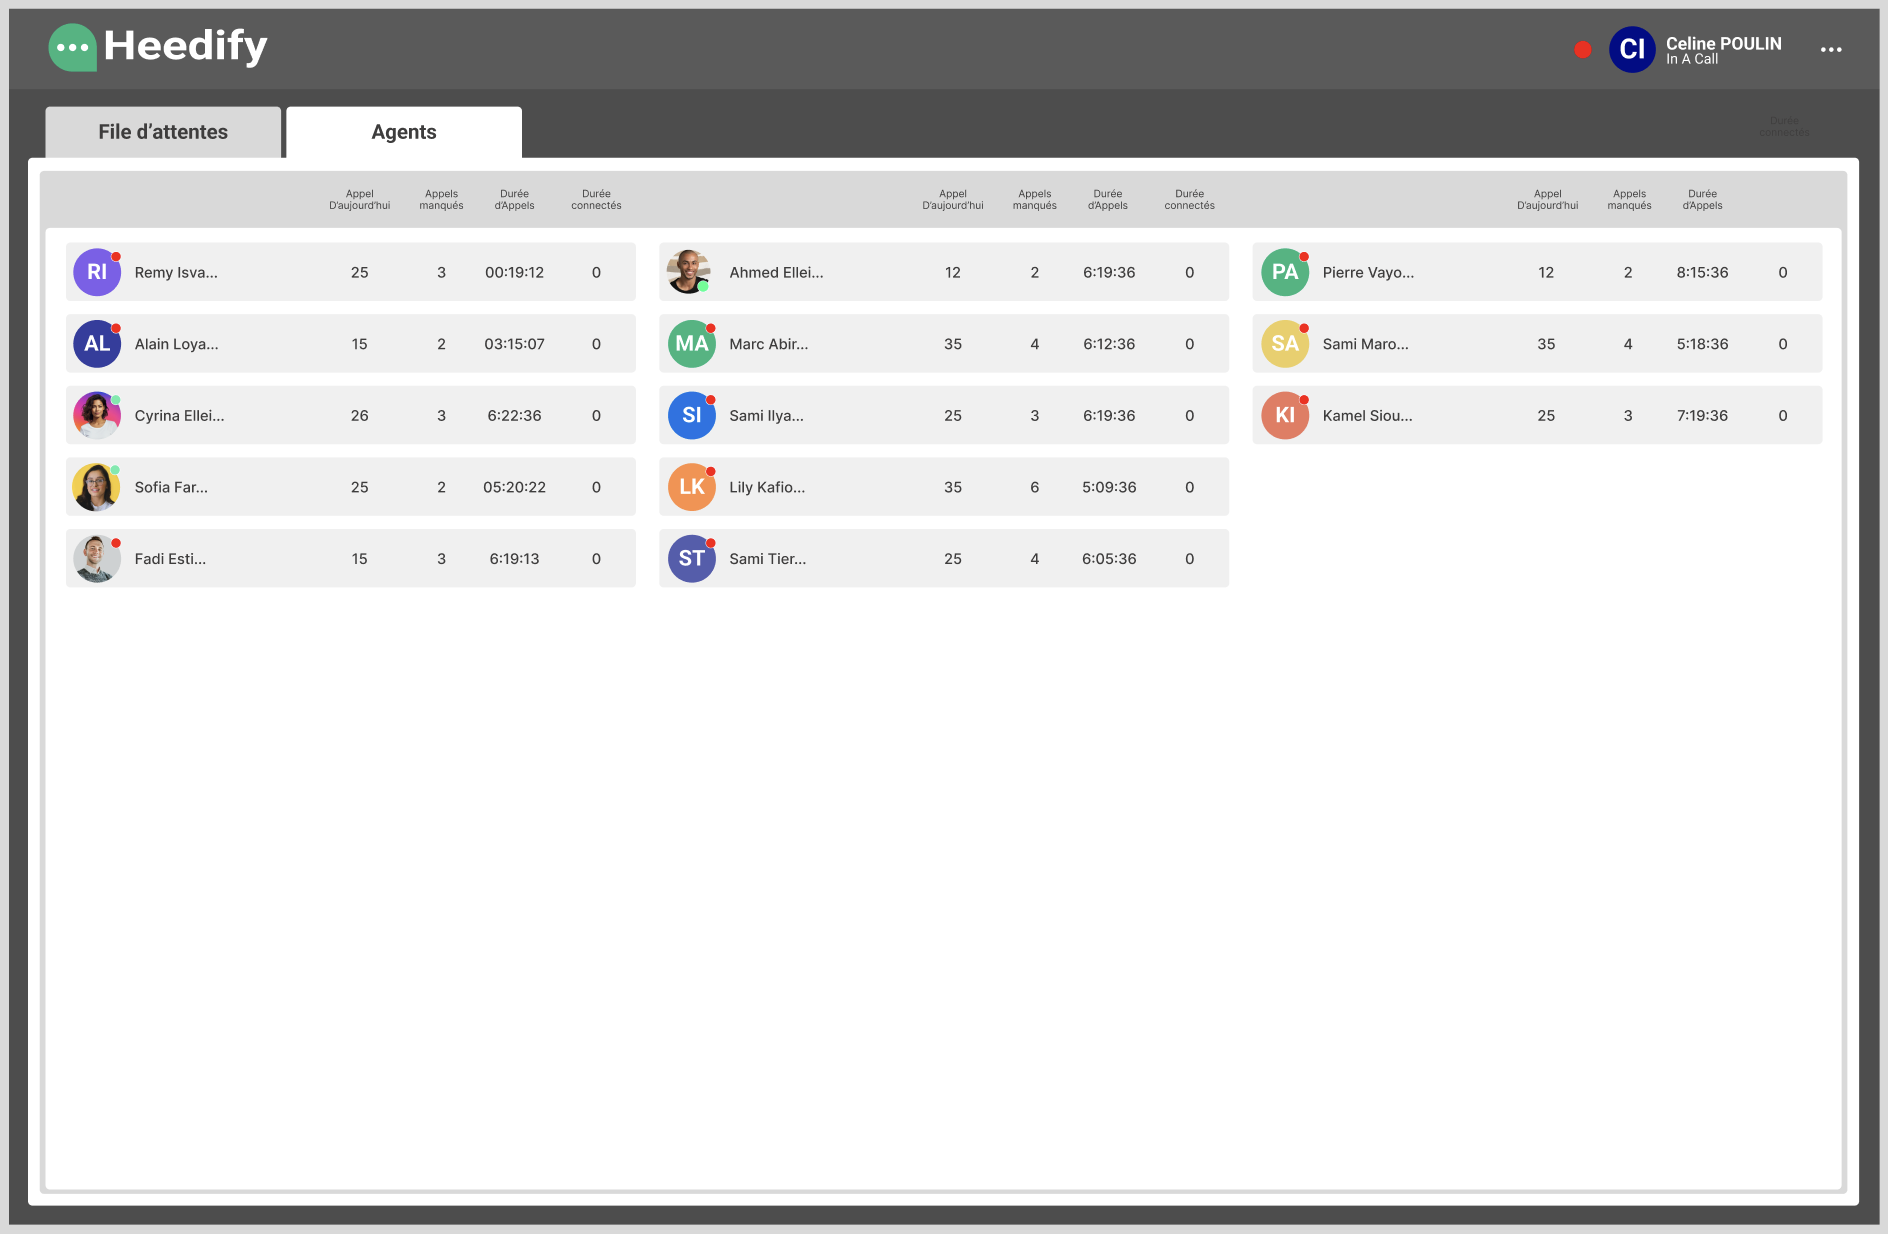
Top-Level Metrics
- Agent: Agent name and Profile Image
- State : Heedify activity state
- Today’s Calls: Number of calls handled by the agent today.
- Missed Calls: Calls missed by the agent.
- Calls Duration: Total duration of calls handled by the agent.
- Connected Calls: Total number of active calls being handled by the agent.