Calls Volumes
This page provides insights into the distribution of calls across different time periods, including months, weeks, and hours. It helps identify call patterns and trends to assist in resource allocation and operational planning.
Filters
- Date Range Selector: A slider that allows users to select a specific date range for analysis.
Visualizations
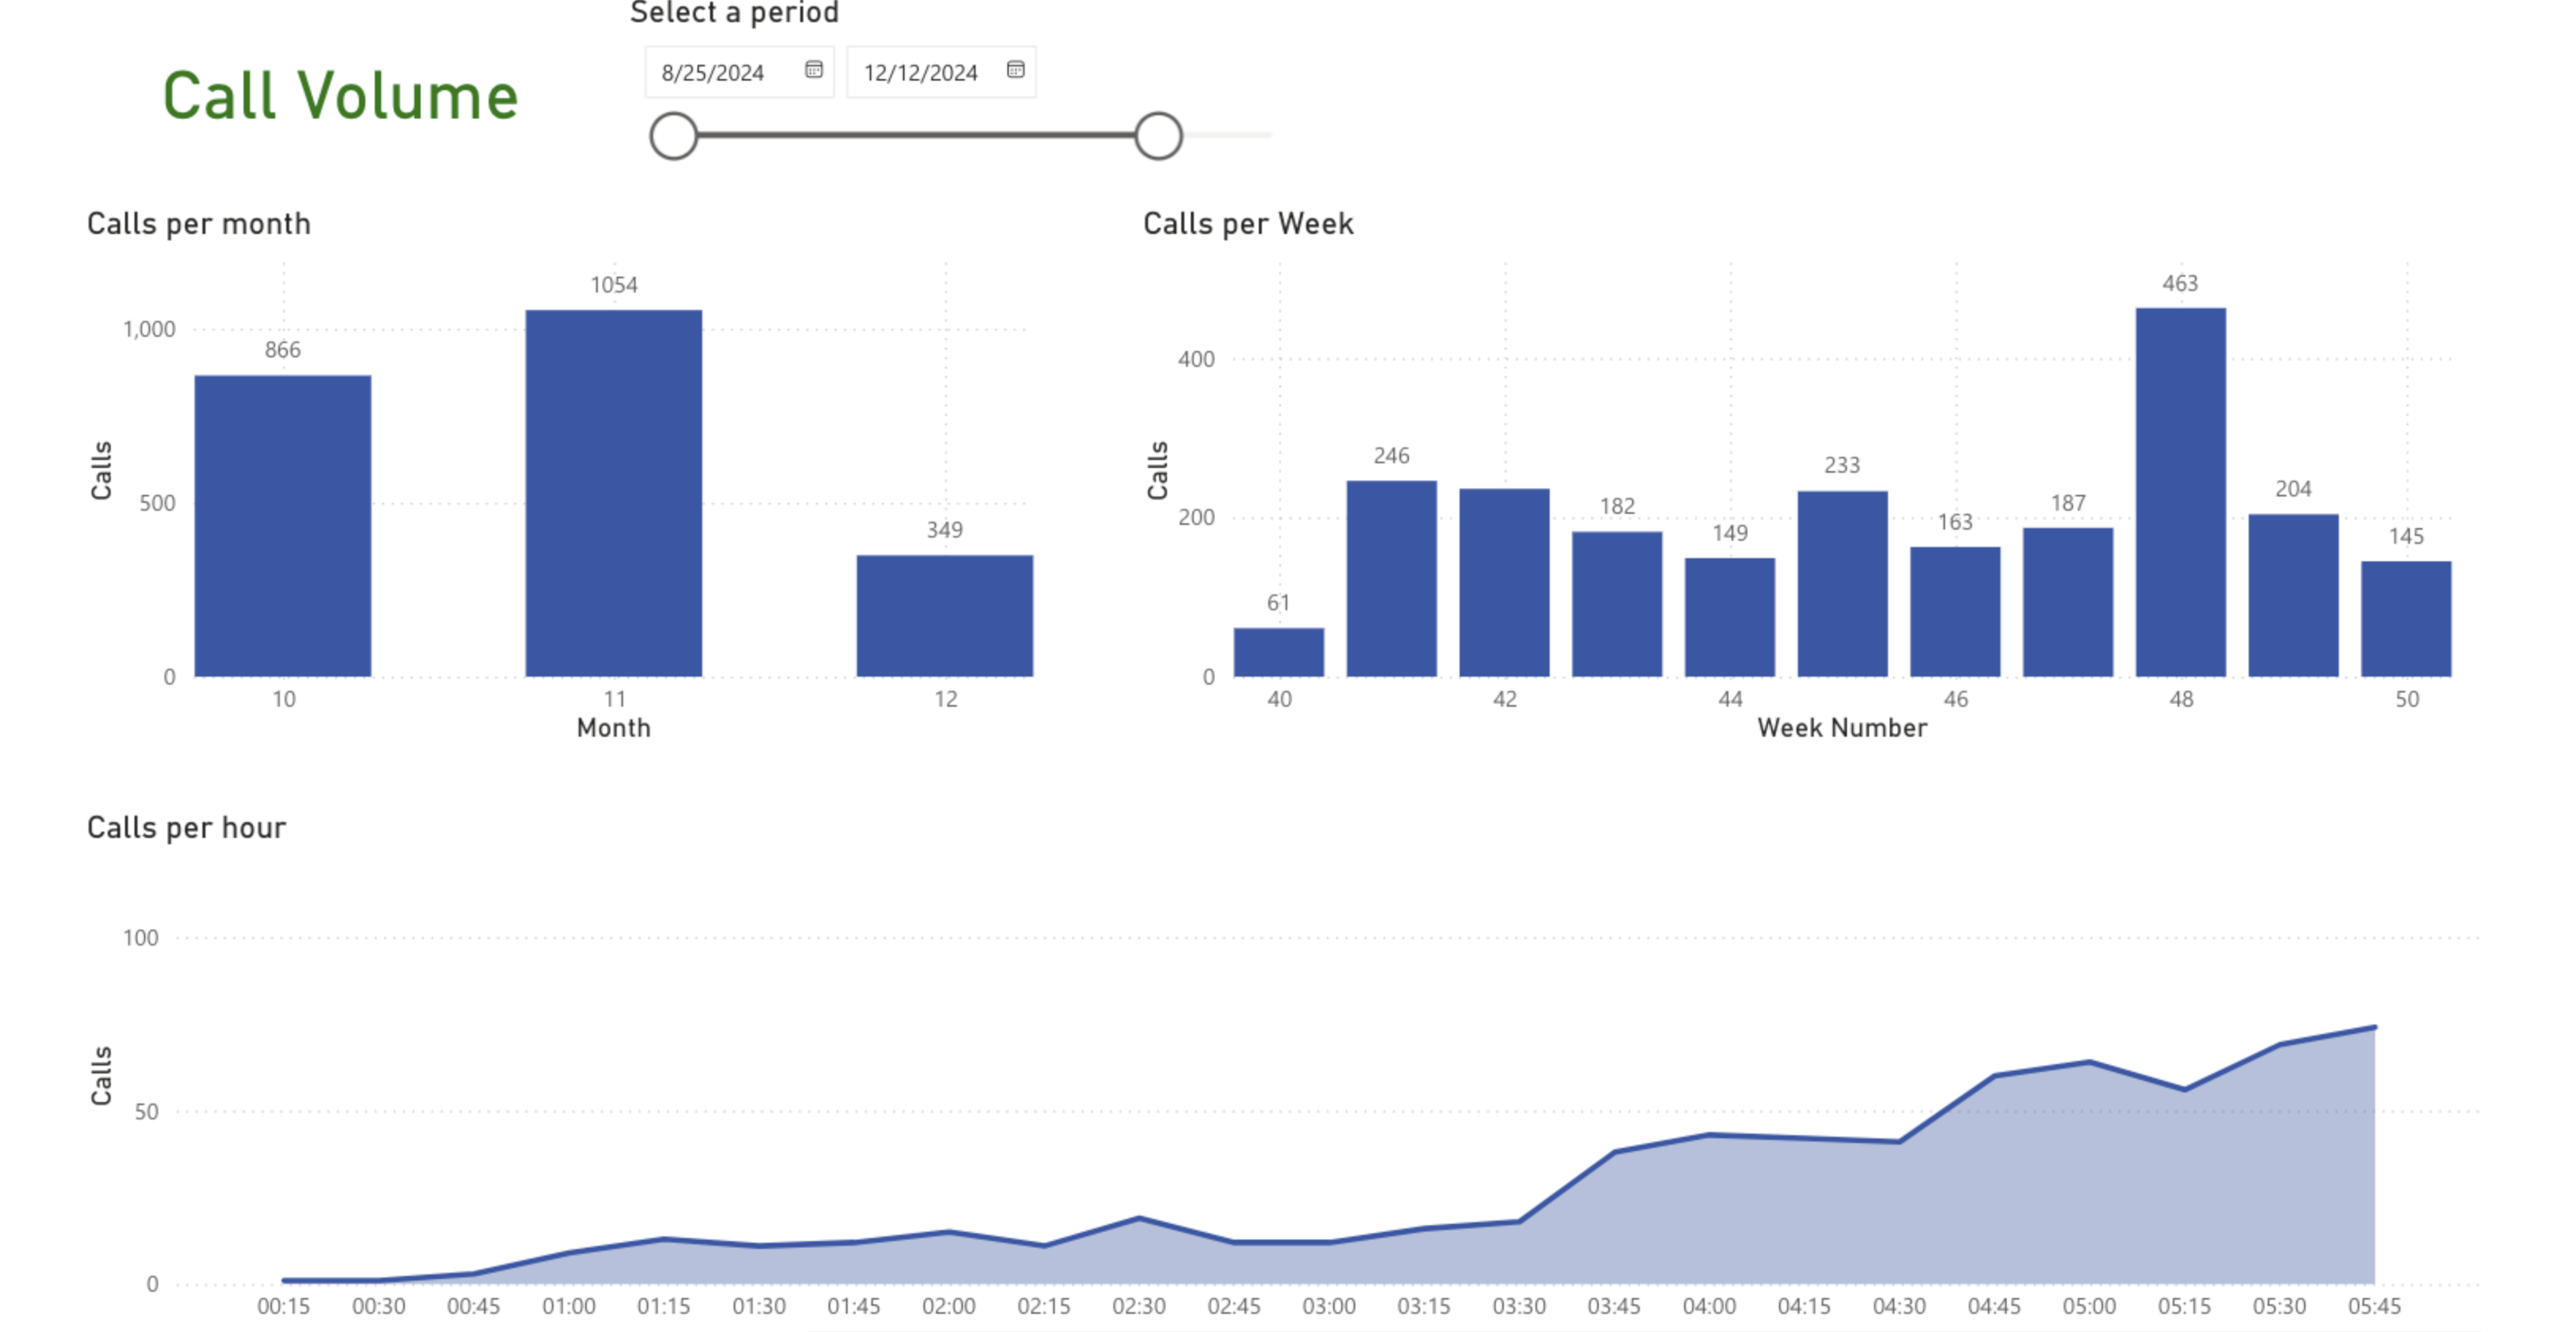
The page includes three main visual elements, each illustrating call volume for a specific time frame:
Calls Per Month
A bar chart displaying the total number of calls received in each month. Example: Month 10 (October): 52 calls.
Calls Per Week
A bar chart showing the number of calls for each week within the selected date range. Example: Week 43: 52 calls.
Calls Per Hour
A line chart illustrating the hourly distribution of calls within the selected date range. Example: Calls peak around a specific hour (e.g., 5 AM) with 15 calls during that time frame.
Calls Per Quarter-Hour
A line chart showing the distribution of calls across each quarter-hour within the selected date range.