Chat Dashboard
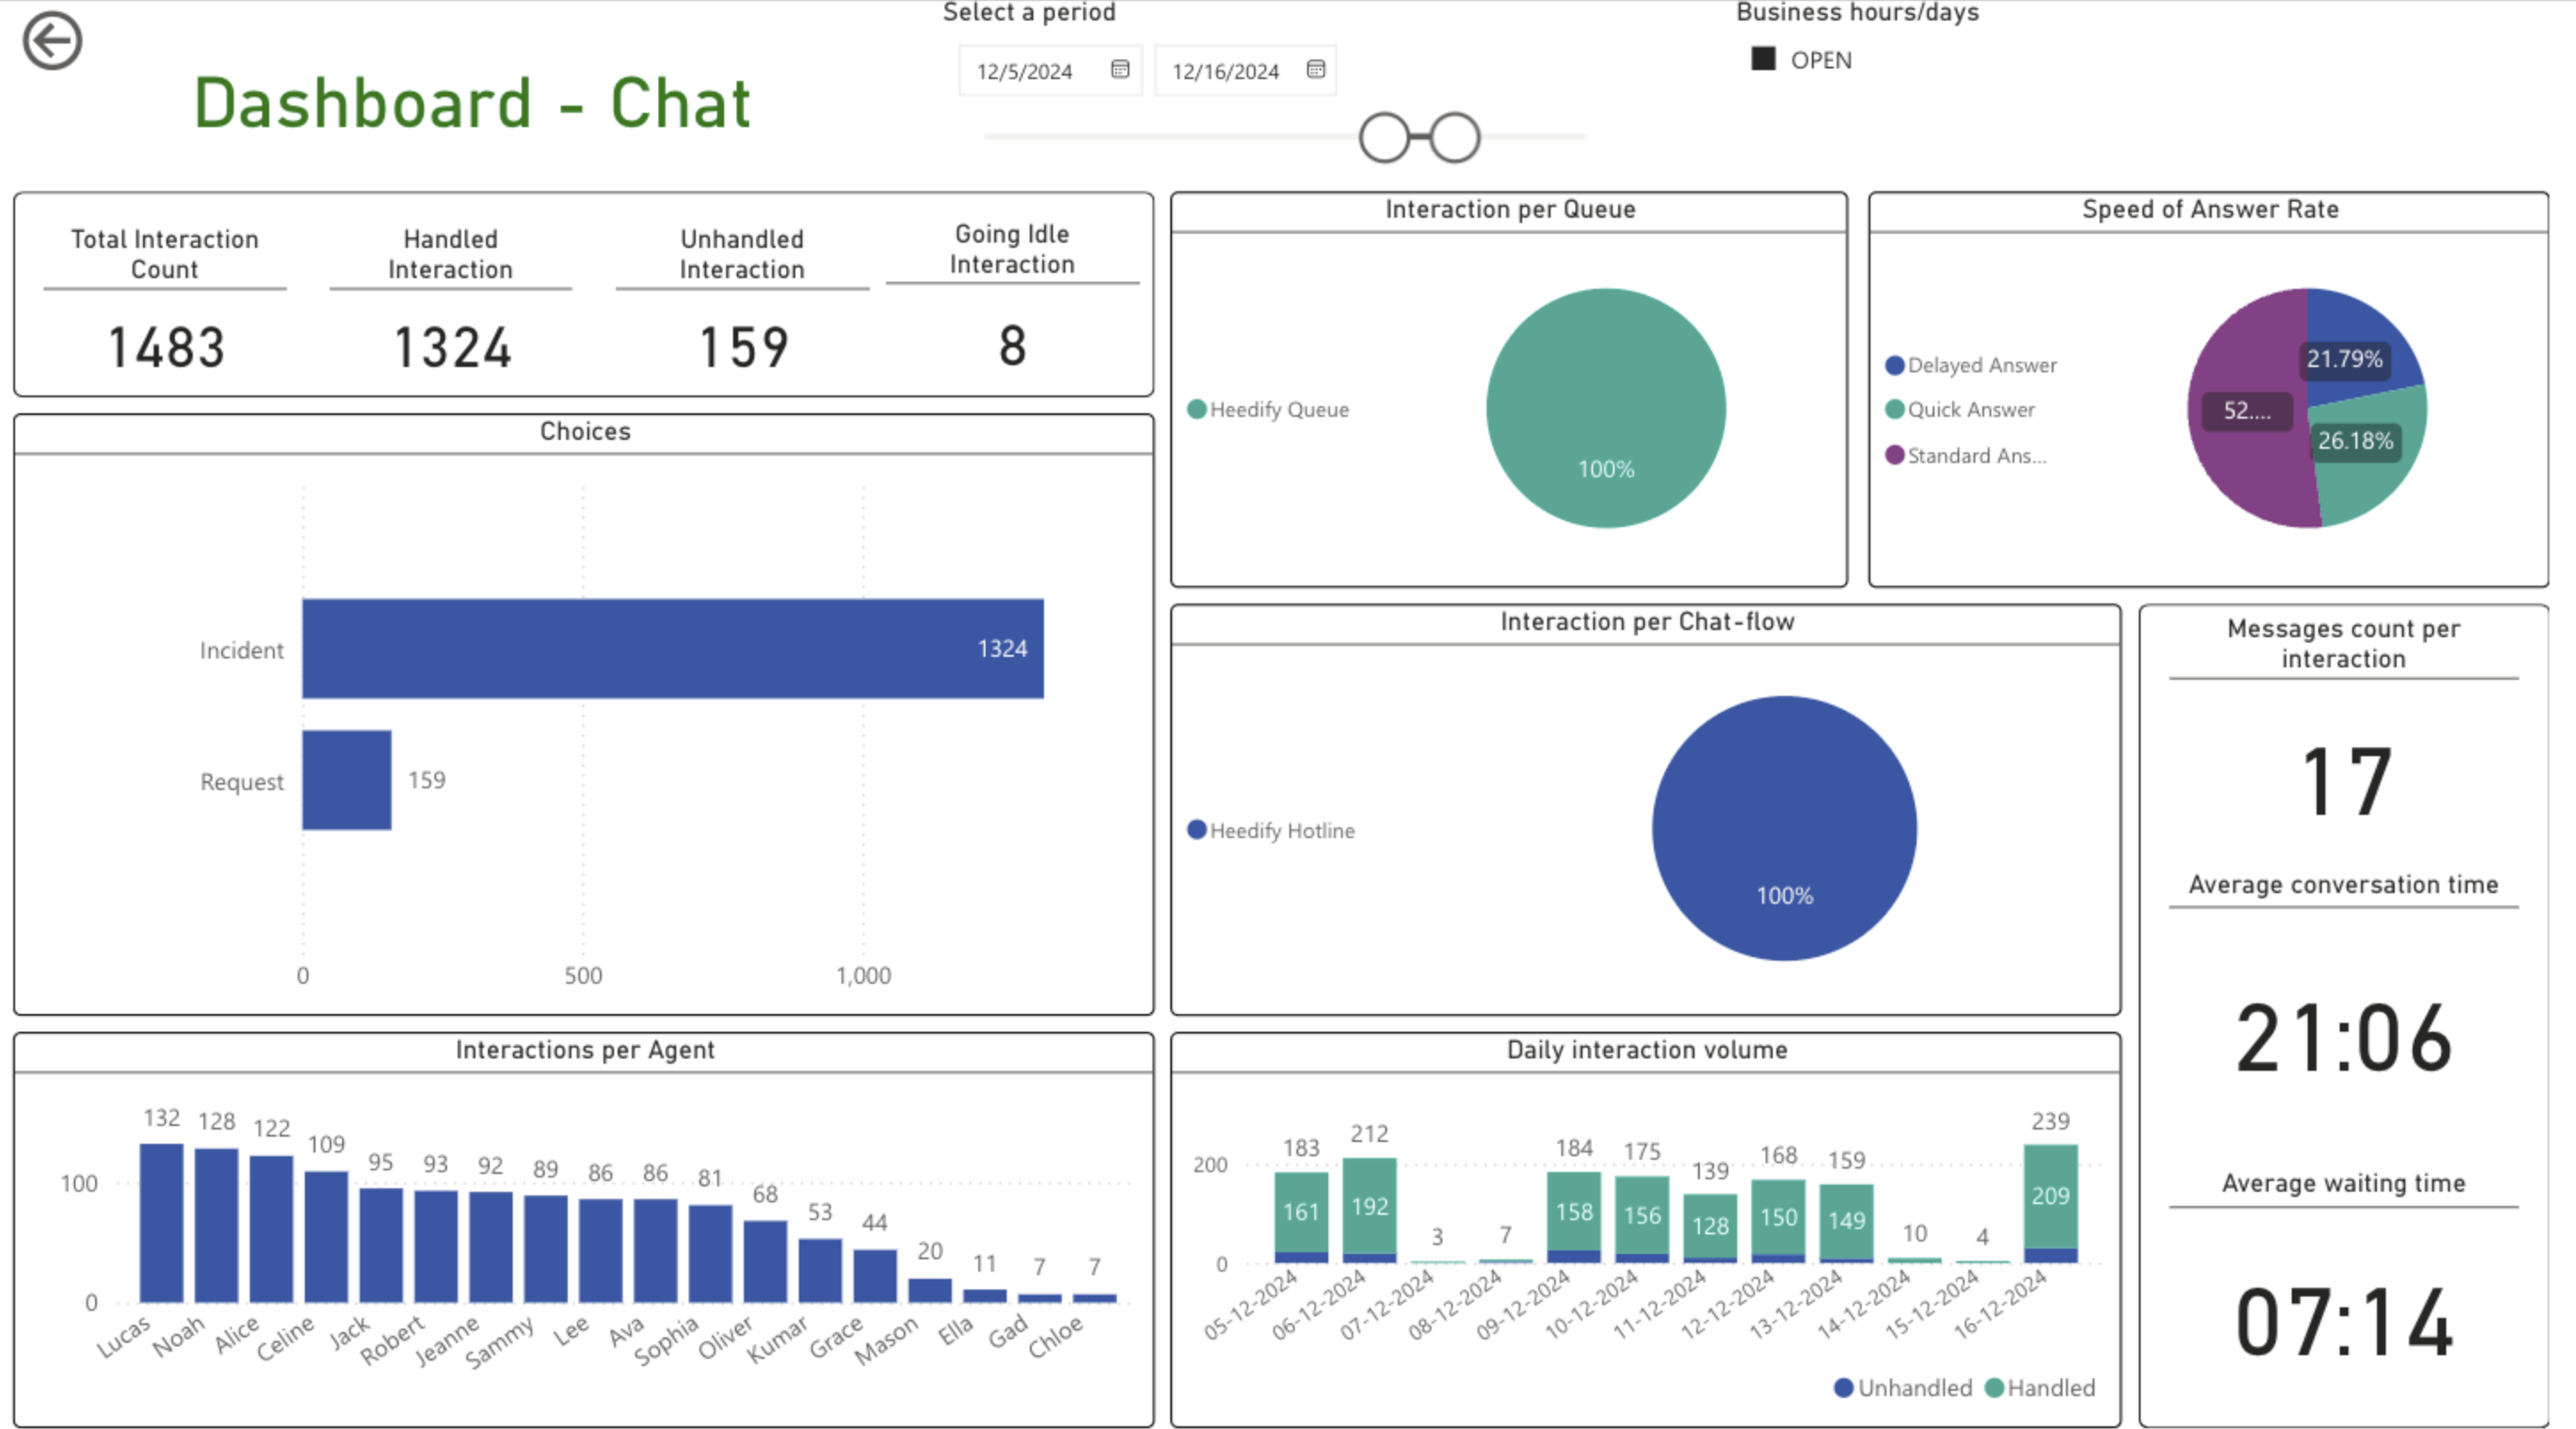
This page provides a detailed analysis of chat interactions. It includes metrics on handled and unhandled chats, response speed, agent performance, and key time-based insights.
Filters
- Date Range Selector: Allows the user to select a specific period for analysis (e.g., from 5/4/2024 to 10/9/2024).
- Business Hours/Days Toggle: Indicates if the data represents open business hours/days.
Key Metrics
- Total Interaction Count: Total number of chat interactions.
- Handled Interaction: Total number of interactions handled successfully.
- Unhandled Interaction: Number of interactions not handled.
- Going Idle Interaction: Number of interactions where the customer or agent went idle.
Visualizations
Interaction per Queue
A pie chart showing the breakdown of interactions by queue.
Speed of Answer Rate
A pie chart categorizing interactions based on the response time:
- Answer > 3 minutes
- Answer < 60 seconds
- Answer > 60 seconds
Daily Interaction Volume
A bar chart showing the total number of interactions handled daily.
Messages Count per Interaction
An indicator showing the average number of messages exchanged per interaction.
Average Conversation Time
A gauge showing the average time spent per conversation.
Average Waiting Time
A gauge displaying the average time a customer waited before receiving a response.
Interactions per Agent
A bar chart showing the number of interactions handled by each agent:
Choices
A stacked bar chart showing the total number of selected choice for each option.