IVR Dashboard
The IVR (Interactive Voice Response) Dashboard provides key insights into the performance of the IVR system, allowing businesses to track call handling efficiency, success rates, and user interactions.
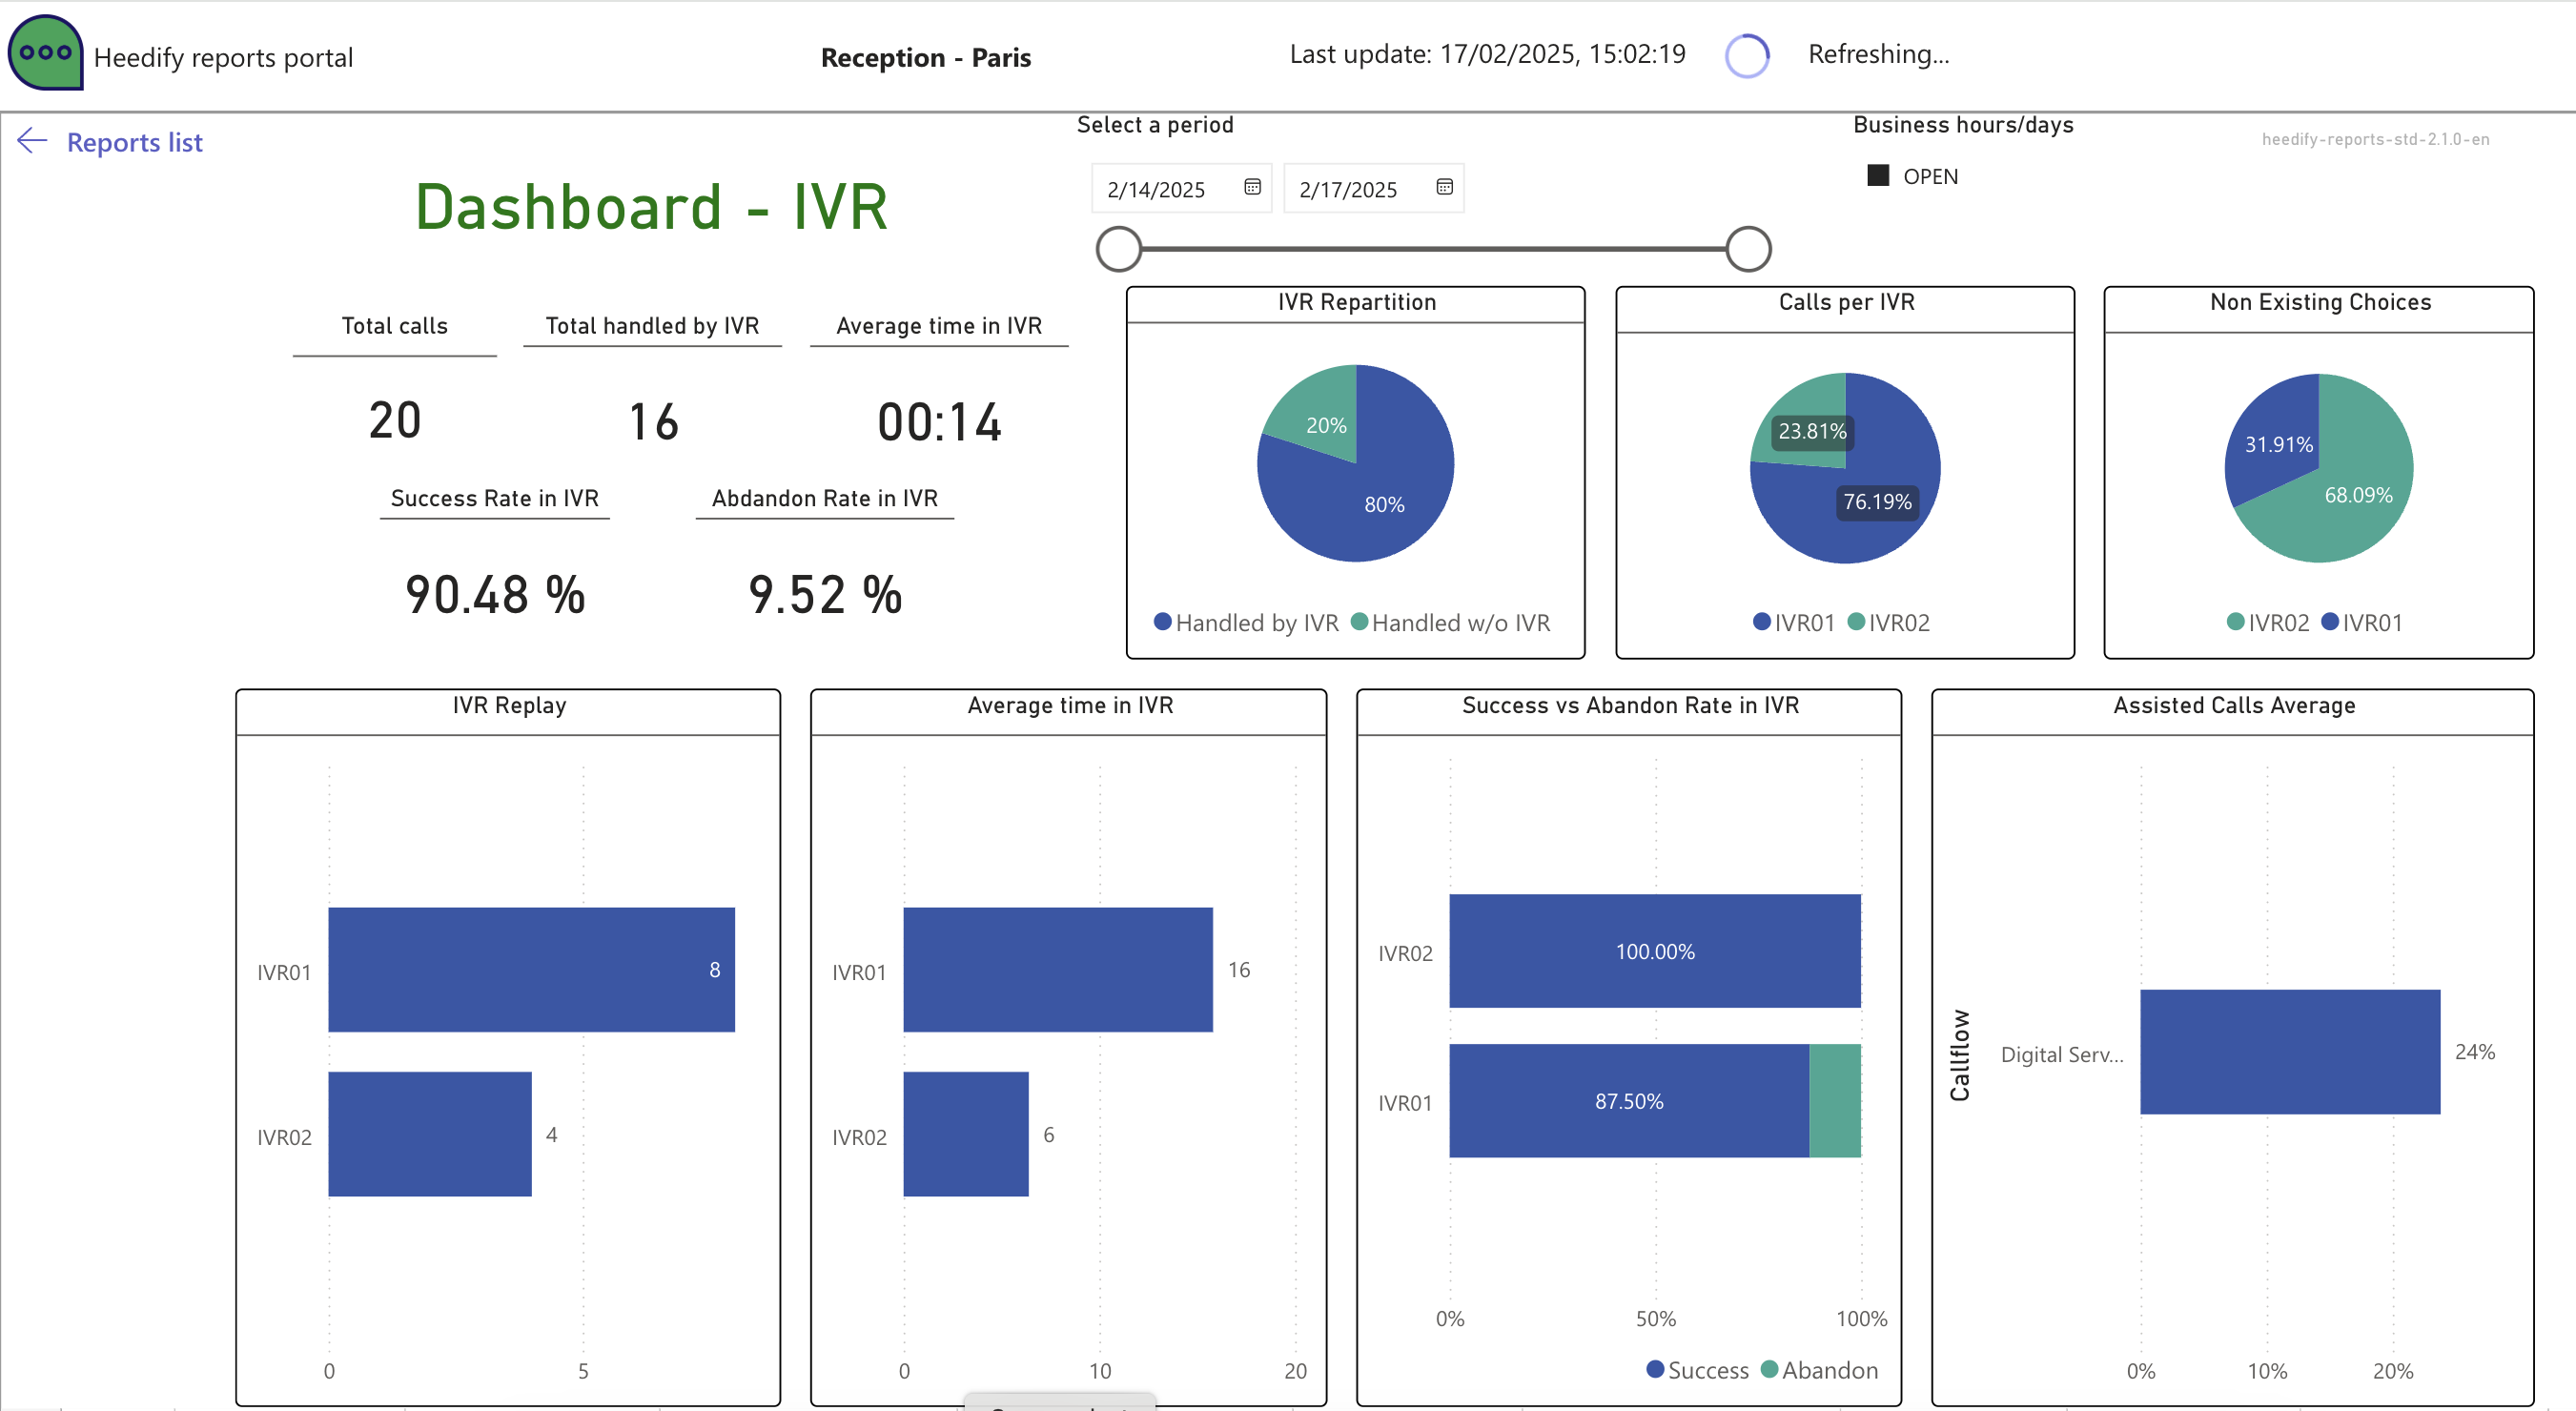
Filters
- Date Range Selector: Allows the user to select a specific period for analysis (e.g., from 5/4/2024 to 10/9/2024).
- Business Hours/Days Checkbox: Indicates if the data represents open business hours/days.
Key Metrics
- Total Calls: Total number of calls recorded in the platform during the selected period.
- Total Handled by IVR: Calls successfully handled by IVR.
- Average Time in IVR: The average duration a caller spends interacting with the IVR.
- Success Rate in IVR: Percentage of calls successfully managed by the IVR system.
- Abandon Rate in IVR: Percentage of callers who abandon the IVR before resolution.
Visualisations
- IVR Repartition (Pie Chart)
- Displays the percentage of calls handled by the IVR vs. those were not routed to an IVR .
- Calls per IVR (Pie Chart)
- Shows the distribution of calls between different IVR nodes.
- Non-Existing Choices (Pie Chart)
- Tracks instances where users select invalid IVR menu options.
- IVR Replay (Bar Chart)
- Displays the number of times users had to replay IVR options.
- Average Time in IVR (Bar Chart)
- Shows the total time spent in IVR by different IVR nodes.
- Success vs. Abandon Rate in IVR (Bar Chart)
- Compares the success and abandonment rates per IVR.
- Assisted Calls Average (Bar Chart)
- Displays the percentage of calls requiring human assistance.